For the last years of my professional life, I’ve always seem to come back to the topic of the “right” way to document architectures of software or ML systems. More precisely, I’ve been looking for a diagrams as code engine that is able to visualize Cloud architectures with appropriate service symbols.
In this post, I’d like to lay out my findings and my current approach.
A short history of architecture diagrams Link to heading
I’ve been using confluence to create documentation for most of my professional life. Confluence comes with a draw.io widget which, naturally, led to me coming into contact with draw.io first. Even though it’s not a diagrams as code engine, it has quality of life features other WYSIWYG solutions lack. One feature I’ve grown to like especially is that it’s possible to embed the source diagram into a PNG image export–which means that we only need to check in one file into version control and there will be no complaints about the person having the source file of the exported diagram being on vacation. Additionally, it lets you download official icons for services of different cloud hyperscalers (Azure, AWS, GCP) so that you can even use it to sketch multi-cloud solutions.
With all these advantages and plusses, draw.io still comes with the usual disadvantage of WYSIWYG solutions: While creating a diagram from scratch is a nice experience, editing and reorganizing an existing diagram is a giant pain in the butt. Adding nodes in the middle of a well-organized, thought-out layout often means re-creating the whole diagram or moving nodes carefully from one place into another–only to realize that there still isn’t enough space for the new piece of architecture. That said, draw.io comes with a “layout” feature that may automatically reorganize your diagram. In my tests, though, this always led to complete destruction and chaos.
Diagrams as code solutions Link to heading
Finding a diagrams as code solution as feature complete as draw.io was a hard, and maybe even impossible, task. Let’s first go over the diagram engines I’m not using anymore.
The Python library
diagrams seemed promising when starting out
but I soon gave up on it: This is not a strong argument, but my guts tell me that
I’d rather have a strict, narrow declaration language than a full-blown programming
language at my disposal when creating diagrams – if only for the reason that I sense
that in the end somebody will abuse that power and generate diagrams rather than
declaring them.
PlantUML is powerful, mature and delivers all features of all diagram types, with icons of Cloud services being supported out of the box via import statements. However, and this is rather a matter of taste than an argument, the rendered diagrams didn’t look as sexy as in the other engines and its syntax didn’t click with me as well as the other ones.
Mermaid Link to heading
I’ve come into contact with mermaid early on in my career and I still think that it has the nicest and most intuitive syntax of all diagrams as code tools. Unfortunately, I couldn’t get mermaid to work with official GCP or AWS icons; the documentation about this is vague because it only states how to import icon packs in JS, while it’s unclear how and where to add that configuration when using mermaid only as a CLI. There’s an open GitHub issue where others are having similar problems, suggesting to rethink the entire architecture diagram feature from scratch.
This is why I only use Mermaid as a gantt chart engine. Here’s an example.
gantt
    title Task Timeline
    axisFormat %W
    tickInterval 1week
    weekday monday

    section Tasks
    Task A: a, 2025-01-06, 1w
    Task B: b, after a, 2w

    section Docs
    Doc A: after b, 3w
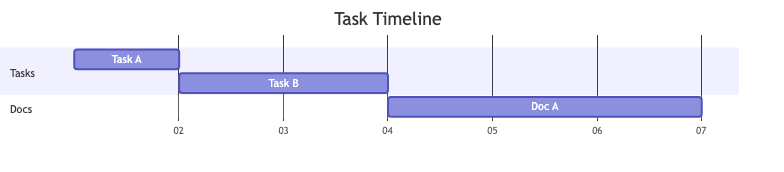
Rendering of a gantt chart with mermaid with two sections
I only do gantt charts for giving a rough project timeline these days, with weeks as a time period. What I like about mermaid: It’s possible to group your components into sections.
While I haven’t figured out a way to generically set the first task to the first week, it’s good enough to specify 2025-01-06 as a start date for the first tasks and then declare dependencies for all following tasks. This way, reorganizing the gantt chart and adding new components is as quick as it gets.
Try the mermaid playground if you want to play around with mermaid yourself.
D2 Link to heading
Here’s a diagram written in d2lang that demonstrates how to create a simple RAG architecture on GCP with it.
direction: right
user: User {
  shape: person
}
gcp_services: "Google Cloud Platform" {
  style.fill: "#ffffdd"
  frontend: "Frontend" {
    icon: "https://icons.terrastruct.com/gcp%2FProducts%20and%20services%2FCompute%2FCloud%20Run.svg"
    shape: image
  }

  backend: "Backend" {
    icon: "https://icons.terrastruct.com/gcp%2FProducts%20and%20services%2FCompute%2FCloud%20Run.svg"
    shape: image
  }

  gemini: "Gemini\n(Vertex AI)" {
    icon: "https://icons.terrastruct.com/gcp%2FProducts%20and%20services%2FAI%20and%20Machine%20Learning%2FAI%20Platform.svg"
    shape: image
  }

  datastore: "AI Application\nData Store" {
    icon: "https://icons.terrastruct.com/gcp%2FProducts%20and%20services%2FDatabases%2FCloud%20Datastore.svg"
    shape: image
  }

  frontend -> backend: "Forward requests"
  backend -> frontend: "Return responses"
  backend -> gemini: "Send requests to gemini"
  gemini -> backend: "Send responses or tool call requests"
  backend <-> datastore: "React to tool call requests"
}
user -> gcp_services.frontend: "Interacts with UI"

Rendering of the d2lang architecture diagram
If you happen to know the icons and styles from the official Google slide deck, this looks different and needs some styling but is good enough for my purposes.
Try the d2lang playground if you want to play around with d2lang yourself.
My current approach Link to heading
Because there’s no single solution that satisfies all my requirements, I’ve come to the following conclusion.
- For architecture and relationship diagrams, I’ll use d2.
- For gantt charts, I’ll use mermaid.